Announcing Swift System Metrics 1.0: Process-Level Monitoring
We are excited to announce the 1.0 release of Swift System Metrics, a Swift package that collects process-level system metrics like CPU utilization time and memory usage. Swift System Metrics runs on both Linux and macOS, providing a common API across platforms.

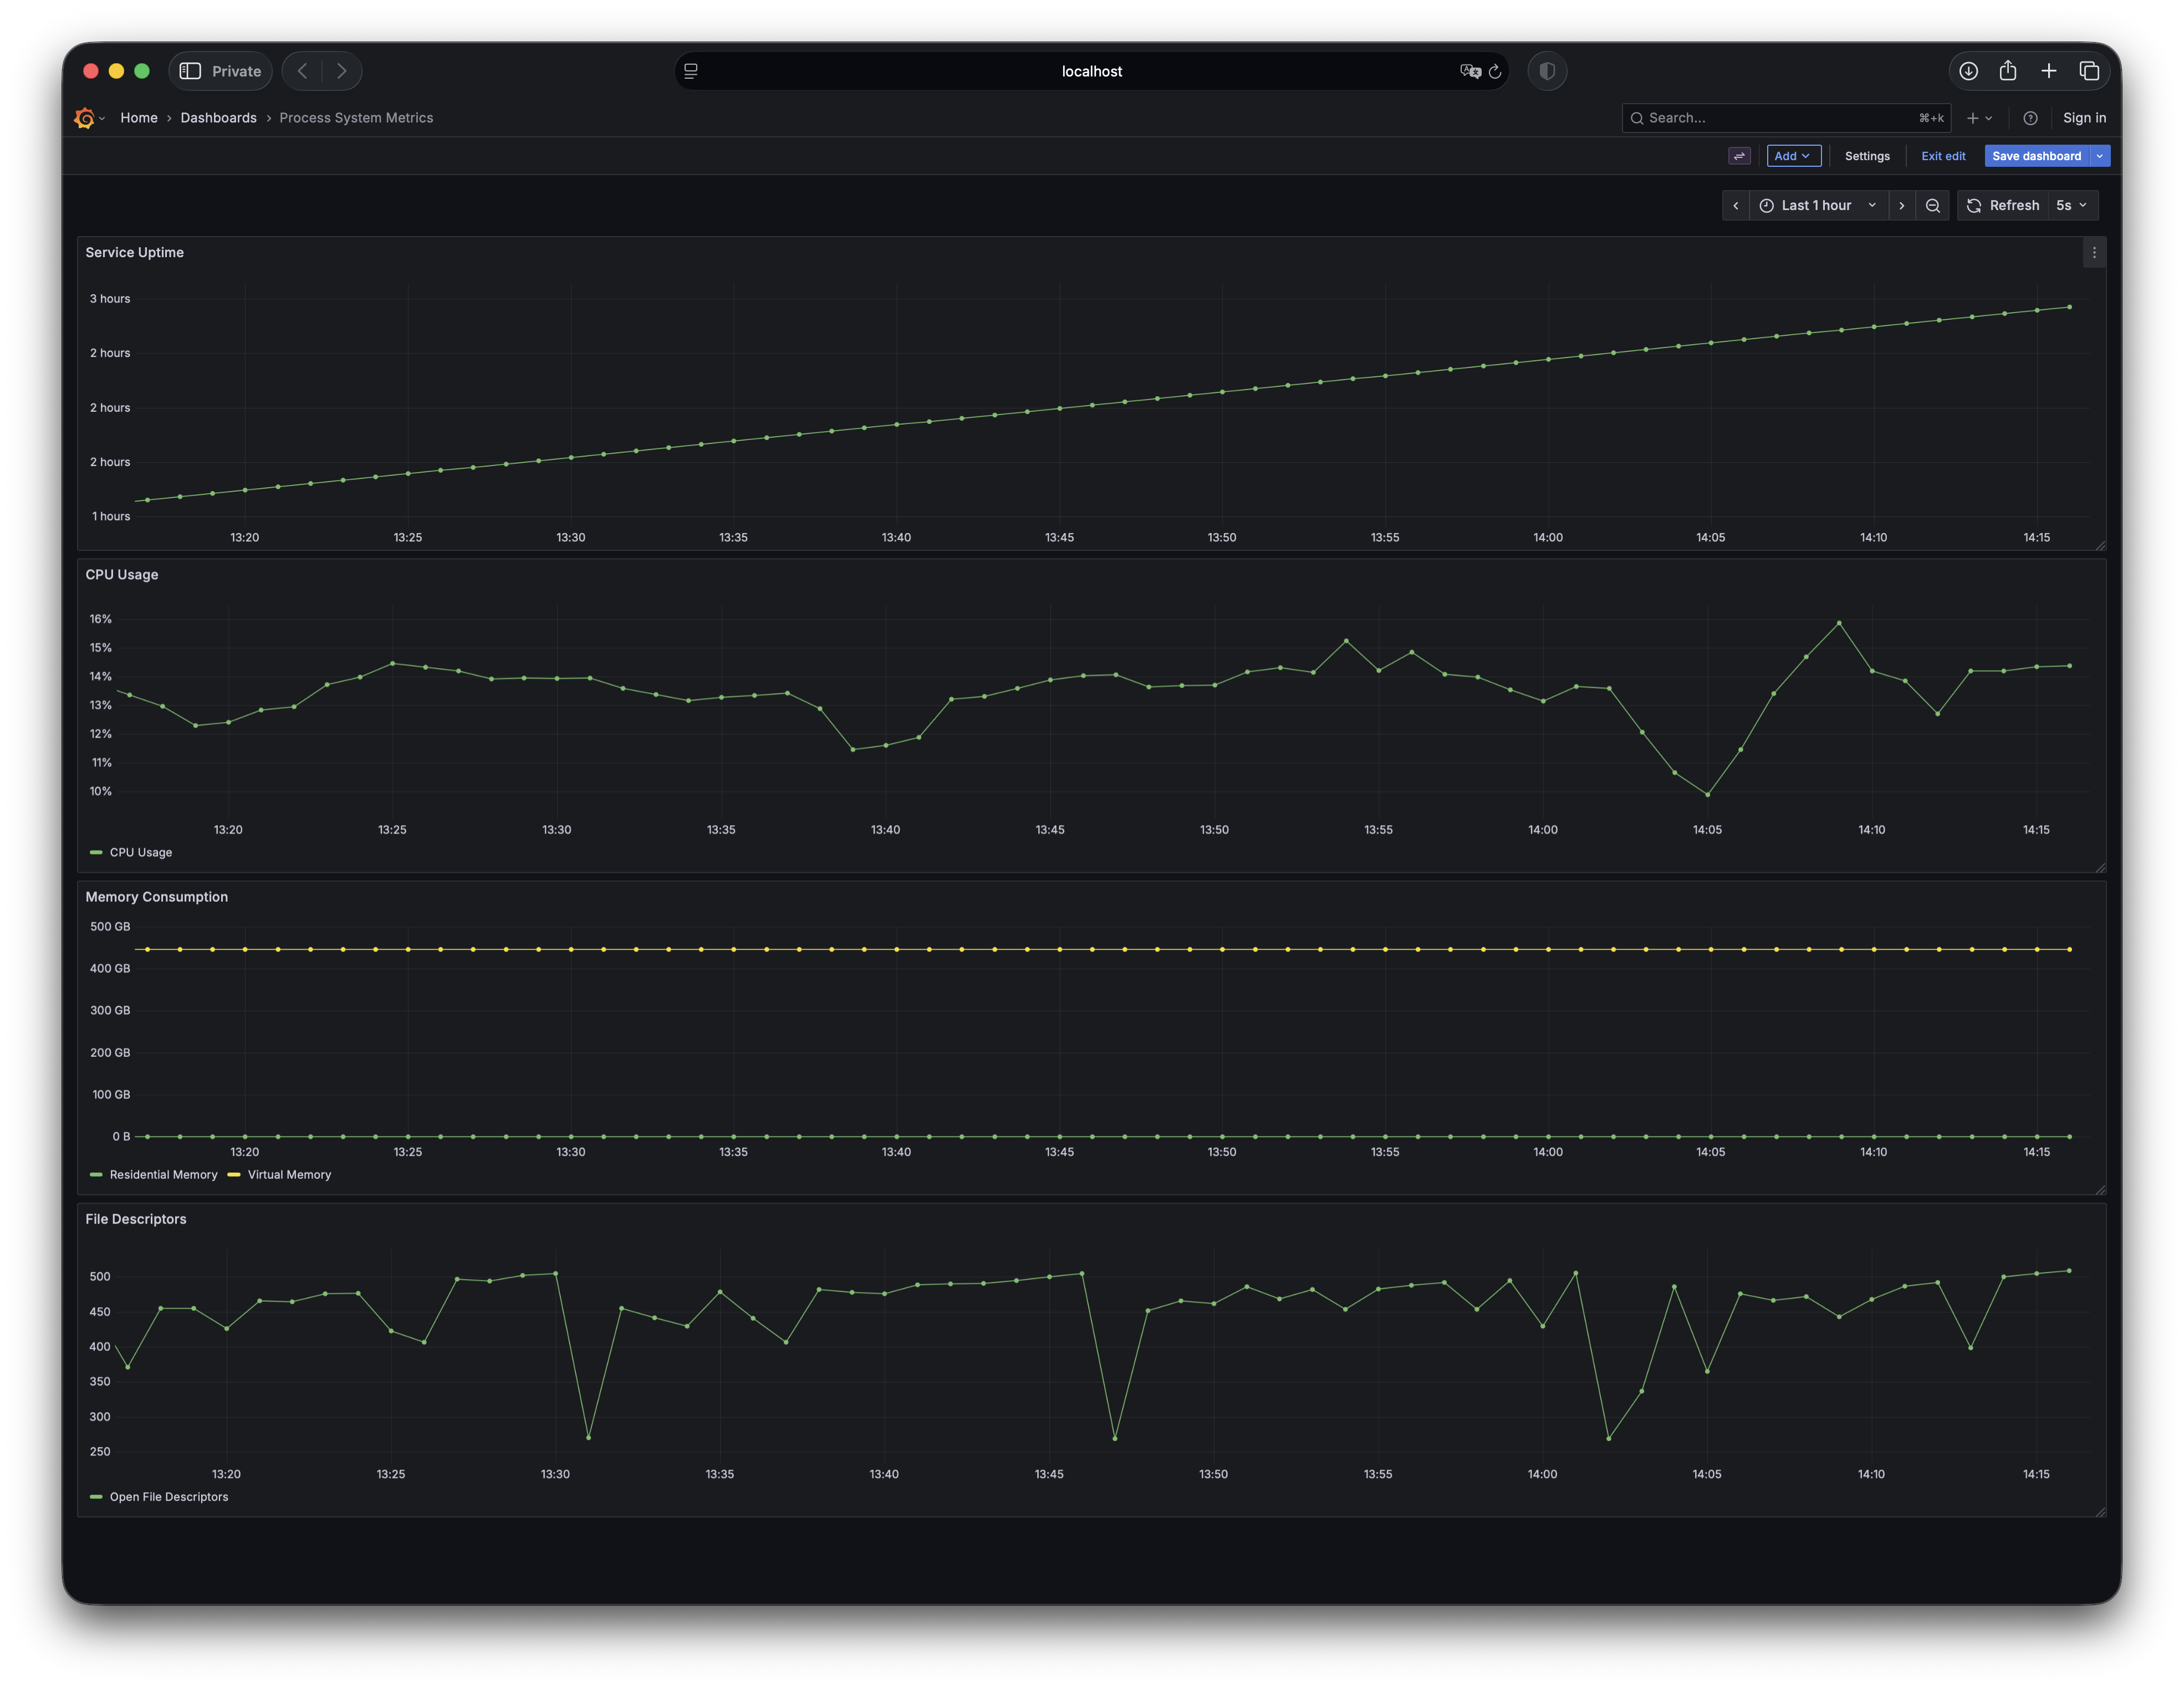
Swift System Metrics visualized in Grafana, demonstrating what's possible with real-time monitoring.
Monitoring process metrics enables you to detect performance issues, optimize resource usage, and ensure your service remains reliable and cost-effective under varying loads. You can integrate Swift System Metrics into your service in just a few lines of code, making observability accessible to every developer and ensuring that even the smallest services can have production-grade visibility from day one.
Swift System Metrics is part of a larger set of packages that provide an end-to-end solution for integrating metrics into your Swift applications and services. Once system metrics are collected, they’re reported to Swift Metrics, a backend-agnostic metrics API that can work with popular backends like Prometheus and OpenTelemetry. Swift System Metrics also leverages Swift Service Lifecycle to handle process bootstrapping and resource cleanup.
With the 1.0 milestone, the API is now stable and ready for use. Note that this package was previously swift-metrics-extras, and renamed to better reflect its purpose.
Highlights
- Collects and reports:
- CPU utilization time
- Virtual and resident memory usage
- Open and maximum available file descriptors
- Process start time
- API-stable public interface
- Support on both Linux and macOS
- musl libc compatibility
The package includes an example Grafana dashboard configuration to start visualizing metrics immediately.
Get Started
Add the dependency to your Package.swift:
.package(url: "https://github.com/apple/swift-system-metrics", from: "1.0.0")
Add the library dependency to your target:
.product(name: "SystemMetrics", package: "swift-system-metrics")
Import and use in your code:
import SystemMetrics
import ServiceLifecycle
import Logging
import OTel

@main
struct Application {
  static func main() async throws {
    // Create a logger, or use one of the existing loggers
    let logger = Logger(label: "Application")

    // Setup MetricsSystem, for example using swift-otel
    var otelConfig = OTel.Configuration.default
    otelConfig.serviceName = "Application"
    let otelService = try OTel.bootstrap(configuration: otelConfig)

    // Setup your service
    let service = FooService()

    // Create the monitor
    let systemMetricsMonitor = SystemMetricsMonitor(logger: logger)

    // Create the service
    let serviceGroup = ServiceGroup(
      services: [otelService, service, systemMetricsMonitor],
      gracefulShutdownSignals: [.sigint],
      cancellationSignals: [.sigterm],
      logger: logger
    )

    try await serviceGroup.run()
  }
}
The complete documentation is available on Swift Package Index.
Get Involved
We’re looking for contributions to grow the list of process metrics collected and to expand platform support. PRs are welcome - our contribution guidelines describe how to get started.
By reaching 1.0, this project will maintain a backwards-compatible API as it continues to evolve. Thanks to everyone who contributed to this release.
